
I recently needed a BuddyPress compatible Wiki component for a project and couldn’t exactly find what I needed with the available plugins in the WordPress repository. The first solution I found was BuddyPress Docs, which is a great plugin but was overly complicated for what I needed. The second solution I found was the Buddypress Wiki Component (bp-wiki). This plugin seemed to fulfill all of my requirements but it had a few bugs. Support for the plugin was lacking and the developer hadn’t updated it in over 2 years. Numerous people had opened support threads indicating it was not compatible with the latest version of WordPress. As a result, I downloaded the plugin and got to work. At this point, I’ve updated the plugin to be compatible with WordPress 3.8+. The frontend editor has been updated to use the wp_editor function in WordPress and javascript has been fixed to allow for inserts and updates to wiki entries. With the permission of the original developer, I’ve placed the updated code on GitHub. You can find the updated code here.
While designing a proof of concept intranet solution in WordPress I wanted to provide a stock quote widget in the template sidebar. I searched through the WordPress plugin repository and found a couple of widgets that display a stock watch list or ticker in the sidebar but none of them provided an on-demand quote. The plugin requirements were simple. I wanted a site visitor to be able to input a ticker symbol in the sidebar and then have a quote displayed in a popup using ajax. Below are some of the plugins I looked at. Stock Quote Sidebar – This widget puts a stock quote list in the sidebar. It has a nice tooltip that displays a historical chart for the ticker symbol. This is a great plugin for a list of predefined stocks. WP Stock Ticker – This plugin creates an actual ticker from a list of ticker symbols. Its under current development and has a decent rating. Although this plugin came up in my search, it isn’t at all what I was searching for. In the end, I decided to build a quick plugin. The plugin is really very simple. It queries the Yahoo stock API for current and historical data and passes the information back to the browser via an ajax call. I decided to use Fancybox to implement the popup. As I began to build the plugin I realized the need to display historical price data in a chart. To this end I chose to use Highcharts as the charting plugin. The popup now displays the current quote and a 1 yr historical price chart for the stock. The following are screenshots of the widget.

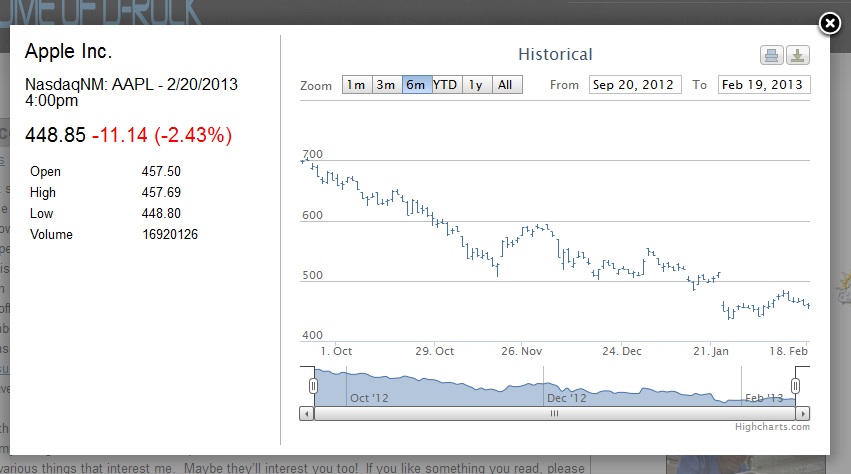
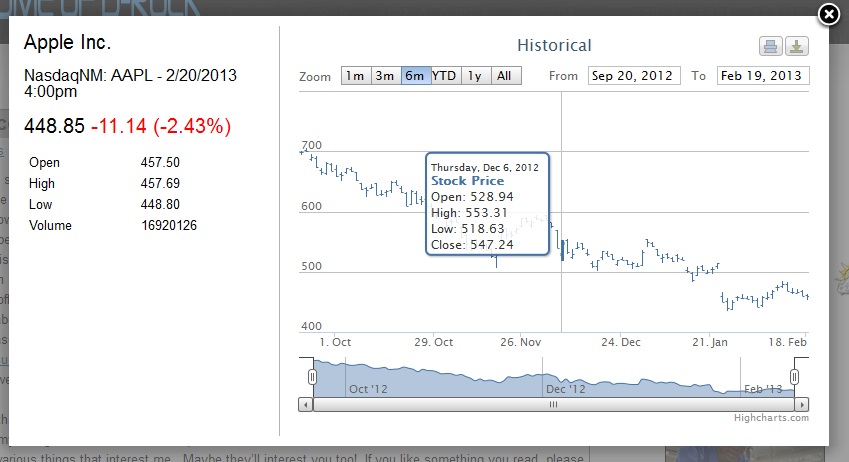
This plugin does require Fancybox. I suggest Easy Fancybox or WP Fancybox. Also, Highcharts is a licensed software. If you intend to use this widget on a commercial site you will want to obtain the appropriate licensing from HighCharts.com. You can download the widget below. I do not plan to maintain the plugin unless there is high interest. If I receive enough feedback I will upload it to the WordPress plugin repository.
[wp_ad_camp_2]
[wpdm_package id=’3862′]
Nagios is an industry leader in network and resource monitoring and GLPI is a great ITIL based help desk system but neither provide integration to each other out of the box. As an IT Manager who uses both systems I found a need to alert the help desk when Nagios recognized a system failure. Of course, Nagios could always send an email alert to a mailbox and then GLPI could pickup that email and create a new ticket. This can work out of the box and I actually ran this configuration for some time but I found out that my help desk was being inundated with tickets that were not being closed and Nagios tickets were filling up the help desk even after the error was rectified on Nagios. Not a very scalable solution. So I set out to find a better solution and my goal was to be able to automatically close GLPI tickets when systems or services return to normal in Nagios. After some research I decided I would write a custom Nagios host and service event handler that opens and closes tickets on GLPI. You can read more about Nagios custom event handlers here You can also download the event handlers at the end of this article. The below event handlers will create new GLPI tickets for Nagios events and close them once the issue has been resolved. These scripts are written in PHP and do require direct access to the GLPI MySQL database. This solution also requires the web services plugin on the GLPI server.
Pulling it all together
Modify the event handler files to include a GLPI username, password and GPLI server IP, GLPI MySQL Username and Password. If you are on GPLI version .80+ then enter a GLPI watcher user ID or GLPI group ID. Then move the files to your /usr/share/nagios/event_handlers/ folder. Next modify your Nagios commands.cfg (/etc/nagios3/commands.cfg) to include the following commands:
# 'manage-host-tickets' command definition
define command{
command_name manage-host-tickets
command_line php /usr/share/nagios3/plugins/eventhandlers/manage-host-tickets.php event="$HOSTSTATE$" state="$HOSTSTATETYPE$" eventhost="$HOSTNAME$" hostattempts="$HOSTATTEMPT$" maxhostattempts="$MAXHOSTATTEMPTS$" hostproblemid="$HOSTPROBLEMID$" lasthostproblemid="$LASTHOSTPROBLEMID$"
}

# 'manage-service-tickets' command definition
define command{
command_name manage-service-tickets
command_line php /usr/share/nagios3/plugins/eventhandlers/manage-service-tickets.php event="$SERVICESTATE$" state="$SERVICESTATETYPE$" hoststate="$HOSTSTATE$" eventhost="$HOSTNAME$" service="$SERVICEDISPLAYNAME$" serviceattempts="$SERVICEATTEMPT$" maxserviceattempts="$MAXSERVICEATTEMPTS$" servicestate="$SERVICESTATE$" lastservicestate="$LASTSERVICESTATE$" servicecheckcommand="$SERVICECHECKCOMMAND$" serviceoutput="$SERVICEOUTPUT$" longserviceoutput="$LONGSERVICEOUTPUT$"
}
Next, modify your generic-host_nagios2.cfg (/etc/nagios3/conf.d)
define host{
        name                            generic-host    ; The name of this host template
        notifications_enabled           1       	; Host notifications are enabled
        event_handler_enabled           1       	; Host event handler is enabled
        flap_detection_enabled          1       	; Flap detection is enabled
        failure_prediction_enabled      1       	; Failure prediction is enabled
        process_perf_data               1       	; Process performance data
        retain_status_information       1       	; Retain status information across program restarts
        retain_nonstatus_information    1       	; Retain non-status information across program restarts
		check_command                   check-host-alive
		event_handler		            manage-host-tickets
		max_check_attempts      1
		notification_interval   0
		notification_period     24x7
		notification_options    d,u,r
		contact_groups          admins
        register                        0       	; DONT REGISTER THIS DEFINITION - ITS NOT A REAL HOST, JUST A TEMPLATE!
        }
And then modify the generic-service-nagios2.cfg (/etc/nagios3/conf.d)
define service{
        name                            generic-service ; The 'name' of this service template
        active_checks_enabled           1       ; Active service checks are enabled
        passive_checks_enabled          1       ; Passive service checks are enabled/accepted
        parallelize_check               1       ; Active service checks should be parallelized (disabling this can lead to major performance problems)
        obsess_over_service             1       ; We should obsess over this service (if necessary)
        check_freshness                 0       ; Default is to NOT check service 'freshness'
        notifications_enabled           1       ; Service notifications are enabled
        event_handler_enabled           1       ; Service event handler is enabled
        flap_detection_enabled          1       ; Flap detection is enabled
        failure_prediction_enabled      1       ; Failure prediction is enabled
        process_perf_data               1       ; Process performance data
        retain_status_information       1       ; Retain status information across program restarts
        retain_nonstatus_information    1       ; Retain non-status information across program restarts
		notification_interval           0		; Only send notifications on status change by default.
		event_handler		            manage-service-tickets
		is_volatile                     0
		check_period                    24x7
		normal_check_interval           5
		retry_check_interval            1
		max_check_attempts              4
		notification_period             24x7
		notification_options            w,u,c,r
		contact_groups                  admins
        register                        0       ; DONT REGISTER THIS DEFINITION - ITS NOT A REAL SERVICE, JUST A TEMPLATE!
        }
You will now receive helpdesk tickets in GLPI when alerts are created in Nagios and those tickets will be removed when the service or host has been restored. GLPI can now handle the appropriate notifications.
Download
[wp_ad_camp_2] [wpdm_file id=1] Happy Monitoring!