Category: Information Security

Derrick Smith Header Image
Recent Posts

Gone are the days when a customer cannot obtain logs related to the security operations of their hosted environments. Many vendors are coming around to the idea of providing their logs for analysis with on-premise solutions. Some are even providing APIs to directly provide those logs. Even SaaS providers are starting to offer log exports.  Proofpoint is one vendor that makes pulling logs easy.

For those unaware, Proofpoint provides hosted spam filtering among other email related services including the anti-phishing solution called Targeted Attack Protection (TAP). The information included in the TAP logs, such as, phishing messages allowed and/or blocked are invaluable for security operations and could help organizations more easily identify and possibly prevent further attack. But the real value of this information is when it can be correlated with other events to gain better insight into the attack.

Proofpoint’s TAP solution includes a webservice API that can be used to gather system logs. The API is fully documented here and they have even created a basic script to help you export logs accordingly.  For my purposes, the script needed to be modified to interact with the Alienvault USM SIEM.

To accomplish this I needed to modify the script to append new logs to a single log file.  After a few simple changes to the script I was able to get it going with a cron job set to run every minute.  I then configured Alienvault to look for that log via the proofpoint-tap plugin.  Finally, I added a logrotate entry to clear the log accordingly.  Below are the changes needed. I’ve also uploaded to Github for those interested.

Modify /etc/ossim/agent/plugins/proofpoint-tap.cfg

location=/var/log/ossim/proofpoint-tap.log

Create a logrotate entry for the plugin.
/etc/logrotate.d/proofpoint-tap

/var/log/ossim/proofpoint-tap.log
{
# save 4 days of logs
rotate 4
# rotate files daily
daily
missingok
notifempty
compress
delaycompress
sharedscripts
# run a script after log rotation
postrotate
invoke-rc.d rsyslog rotate > /dev/null
endscript
}

Copy the following shell script to your SIEM. Modify the file with your principal and secret variables.  Then create a CRON job to run every minute.
* * * * * sh /opt/proofpoint-tap/retrieve-tap-siem-logs.sh

#author          :Proofpoint
#date            :2017-04-07
#version         :1.1
#usage           :bash retrieve-tap-siem-logs.sh

############################################################
#Version History
# 1.0    Initial Release
# 1.1    Some old versions of the 'date' command didn't support
#         ISO8601-formatted timestamps. Fixed to be friendlier to
#        those old versions.
# 1.2	 Modified by Derrick Smith - modified for alienvault directories, logs to single /var/log/ossim/proofpoint-tap.log file
############################################################


#=============USER CONFIGURABLE SETTINGS===================#
# The service principal and secret are used to authenticate to the SIEM API. They are generated on the settings page of the Threat Insight Dashboard.
PRINCIPAL=""
SECRET=""

# Determines which API method is used. Valid values are: "all", "issues",
# "messages/blocked", "messages/delivered", "clicks/permitted", and "clicks/blocked"
ACTION="all"

# Determines which format the log is downloaded in. Valid values are "syslog" and "json".
FORMAT="syslog"

# Determines where log file are downloaded. Defaults to the current working directory.
LOGDIR="/var/log/ossim"
#=============END USER CONFIGURABLE SETTINGS===================#

LASTRETRIEVALFILE="$LOGDIR/lastretrieval"
LOGFILESUFFIX="proofpoint-tap.log"
ERRORFILESUFFIX="tap-siem.error"
TMPFILESUFFIX="tap-siem.tmp"
CURRENTTIME_ISO=`date -Iseconds | tr "T" " "`
echo $CURRENTTIME_ISO
CURRENTTIME_SECS=`date -d "$CURRENTTIME_ISO" +%s`
echo $CURRENTTIME_SECS
function interpretResults {
        local STATUS=$1
        local EXITCODE=$2
        local TIME_ISO=$3
        local TIME_SECS=$4
        if [[ $EXITCODE -eq 0 ]] && [[ $STATUS -eq 200 ]]; then
                echo $TIME_ISO > $LASTRETRIEVALFILE
                cat "$LOGDIR/$TIME_SECS-$TMPFILESUFFIX" >> "$LOGDIR/$LOGFILESUFFIX"
				rm "$LOGDIR/$TIME_SECS-$TMPFILESUFFIX"
                echo "Retrieval successful. $LOGDIR/$LOGFILESUFFIX created."
                return 0
        fi
        if [[ $EXITCODE -eq 0 ]] && [[ $STATUS -eq 204 ]]; then
                echo $TIME_ISO > $LASTRETRIEVALFILE
                rm "$LOGDIR/$TIME_SECS-$TMPFILESUFFIX"
                echo "Retrieval successful. No new records found."
                return 0
        fi

        mv "$LOGDIR/$TIME_SECS-$TMPFILESUFFIX" "$LOGDIR/$TIME_SECS-$ERRORFILESUFFIX"
        echo "Retrieval unsuccessful. $LOGDIR/$TIME_SECS-$ERRORFILESUFFIX created."
        logger -p user.err "Failed to retrieve TAP SIEM logs. Error in $LOGDIR/$TIME_SECS-$ERRORFILESUFFIX."
        return 1
}

function retrieveSinceSeconds {
        SECONDS=$1
        STATUS=$(curl -X GET -w %{http_code} -o "$LOGDIR/$CURRENTTIME_SECS-$TMPFILESUFFIX" "https://tap-api-v2.proofpoint.com/v2/siem/$ACTION?format=$FORMAT&sinceSeconds=$SECONDS" --user "$PRINCIPAL:$SECRET" -s)
        EXITCODE=$?
        interpretResults $STATUS $EXITCODE "$CURRENTTIME_ISO" "$CURRENTTIME_SECS"
}

function retrieveSinceTime {
        TIME=$1
        STATUS=$(curl -X GET -w %{http_code} -o "$LOGDIR/$CURRENTTIME_SECS-$TMPFILESUFFIX" "https://tap-api-v2.proofpoint.com/v2/siem/$ACTION?format=$FORMAT&sinceTime=$TIME" --user "$PRINCIPAL:$SECRET" -s)
        EXITCODE=$?
        interpretResults $STATUS $EXITCODE "$CURRENTTIME_ISO" "$CURRENTTIME_SECS"
}

function retrieveInterval {
        START_ISO=$1
        END_ISO=$2
        END_SECS=$3
        STATUS=$(curl -X GET -w %{http_code} -o "$LOGDIR/$END_SECS-$TMPFILESUFFIX" "https://tap-api-v2.proofpoint.com/v2/siem/$ACTION?format=$FORMAT&interval=$START_ISO/$END_ISO" --user "$PRINCIPAL:$SECRET" -s)
        EXITCODE=$?
        interpretResults $STATUS $EXITCODE "$END_ISO" "$END_SECS"
}

if ! [[ -f $LASTRETRIEVALFILE ]]; then
        echo "No interval file found. Retrieving past hour's worth of data."
        retrieveSinceSeconds 3600
else
        LASTRETRIEVAL_ISO=`date -f "$LASTRETRIEVALFILE" -Iseconds `
        LASTRETRIEVAL_SECS=`date -d "$LASTRETRIEVAL_ISO" +%s`
    (( DIFF=$CURRENTTIME_SECS - $LASTRETRIEVAL_SECS ))

        if [ $DIFF -lt 60 ]; then
                echo "Last retrieval was $DIFF seconds ago. Minimum amount of time between requests is 60 seconds."
                logger -p user.err "Last retrieval was $DIFF seconds ago. Minimum amount of time between requests is 60 seconds. Exiting."
                exit 0
        fi

        if [ $DIFF -gt 43200 ]; then
            echo "Last successful retrieval of SIEM logs was $DIFF seconds ago. Maximum amount of time to look back is 43200 seconds (12 hours). Resetting last interval. Information older than 12 hours will not be retrieved."
                        logger -p user.warn "Last successful retrieval of SIEM logs was $DIFF seconds ago. Maximum amount of time to look back is 43200 seconds (12 hours). Resetting last interval. Information older than 12 hours will not be retrieved."
                        ((LASTRETRIEVAL_SECS=$CURRENTTIME_SECS-43140))
                        LASTRETRIEVAL_ISO=`date -d @$LASTRETRIEVAL_SECS -Iseconds`
                        (( DIFF= $CURRENTTIME_SECS - $LASTRETRIEVAL_SECS ))
    fi

        if [ $DIFF -gt 3600 ]; then
                echo "Last retrieval was $DIFF seconds ago. Maximum amount of allowable time for one request is 3600 seconds. Will split into several requests."
                START_ISO=$LASTRETRIEVAL_ISO
                START_SECS=$LASTRETRIEVAL_SECS
                while [ $DIFF -gt 3600 ]; do
                        ((END_SECS=$START_SECS+3600))
                        END_ISO=`date -d @$END_SECS -Iseconds`
                        (( DIFF=$CURRENTTIME_SECS - $END_SECS ))
                        retrieveInterval $START_ISO $END_ISO $END_SECS
                        START_SECS=$END_SECS
                        START_ISO=$END_ISO
                done
                LASTRETRIEVAL_ISO=$END_ISO
        fi

        if [ $DIFF -le 3600 ]; then
                retrieveSinceTime $LASTRETRIEVAL_ISO
        fi
fi

Be sure to reconfigure Alienvault with the alienvault-reconfig command. Afterwards, enjoy all the Proofpoint goodness inside Alienvault.

This post is an update to an earlier post regarding integrating Nagios with GLPI that can be found here.  Due to recent improvements in the GLPI distribution I decided to rewrite the eventhandlers.  You can find a link to GitHub at the bottom of this post.

One of the key pillars of information security is availability of resources and as a proponent of using open source solutions whenever possible I have chosen to utilize Nagios for monitoring and GLPI for helpdesk solutions.  Nagios provides powerful monitoring capabilities for equipment, hosts and services but doesn’t integrate with ticketing systems directly which can make tracking and reporting difficult.  GLPI is an ITIL based helpdesk solution that provides asset and incident/request management.  It offers generous reporting out of the box and a webservices API that can be used to extend the system.  When used together these two systems can provide a way to track host and service availability and a way to report on the health and resolution metrics of those systems over time.

As shown in my previous post regarding the integration of Nagios and GLPI, the marriage of the two systems is done using the built-in Nagios eventhandler action and the GLPI webservices API.  In previous versions of GLPI, a webservices plugin was used to create the API endpoints.  As of GLPI version 9.1, a webservices API is included in the core package.  The following procedure for integrating GLPI with Nagios will only work with GLPI 9.1+.  The event handlers have also been improved and use an object oriented approach.  The PHP xml_rpc extension has been replaced with the curl extension.  Be sure curl is installed before using these scripts.

GLPI Configuration

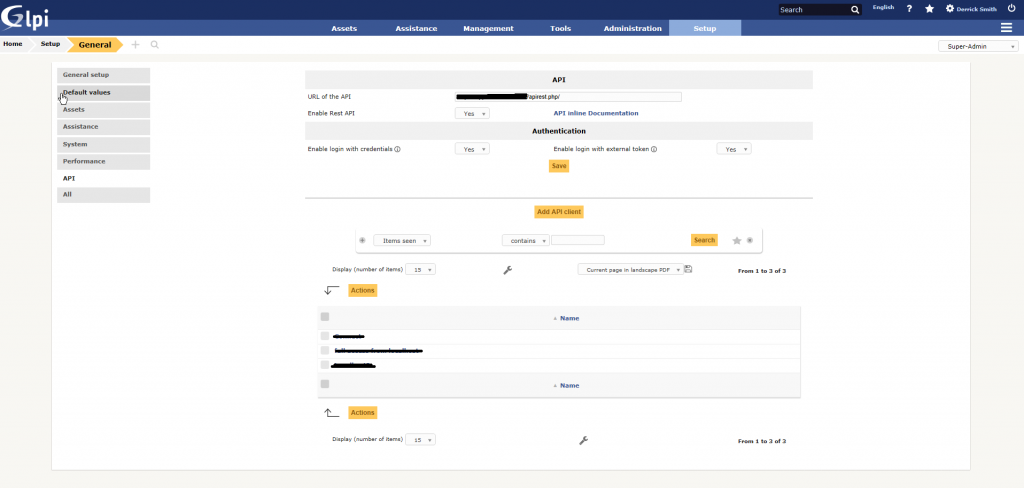
First, enable the API and create an API client on the API Settings page in GLPI located under Setup > General > API.   Enable both Authentication settings to allow your API client to login with credentials and an authentication key.  Be sure to copy the API URL and the API key for the client.  Although the event handler scripts can use any GLPI account that has ticket creation permission to create new tickets, it is recommended to create a new user account that will be used specifically for API transactions.

Nagios Configuration

Depending on the version of Nagios and the base operating system, Nagios could be installed into several possible locations.  I typically use Ubuntu Server and the directories listed below are for Nagios3 – your directories may be different.

First, open the host and service event handlers and change the variables at the top of each script to reflect your environment.  The scripts include the following variables:

## Required ##
$glpi_user				= '';
$glpi_password				= '';
$glpi_apikey				= '';
$glpi_host				= '';
$nagios_host				= '';
$verifypeer				= FALSE; // SETS curl_setopt ($curl, CURLOPT_SSL_VERIFYPEER, FALSE);
$logging				= TRUE;
$critical_priority			= 5;
$warning_priority			= 3;

## Optional ##
$glpi_requester_user_id		= '';
$glpi_requester_group_id	= '';
$glpi_watcher_user_id		= '';
$glpi_watcher_group_id		= '';
$glpi_assign_user_id		= '';
$glpi_assign_group_id		= '';

The initial variables are self-explanatory.  The ssloff variable should be set to true if your site is http, you are using a self-signed certificate for https or your ssl configuration prevents successful certificate validation.  The optional variables are used to control how new tickets are opened and if initial watchers and ticket owners are used.  Use these variables to control which groups or users are notified of new tickets and when tickets are closed.

After you have modified the scripts, copy them and the glpi_api class to the Nagios eventhandler directory.  Next, modify the Nagios commands.cfg file to include the following commands.  Be sure to replace the directory with the correct event handler directory for your Nagios installation.

# 'manage-host-tickets' command definition
define command{
command_name manage-host-tickets
command_line php /usr/share/nagios3/plugins/eventhandlers/manage-host-tickets.php hoststate="$HOSTSTATE$" hoststatetype="$HOSTSTATETYPE$" eventhost="$HOSTNAME$" hostattempts="$HOSTATTEMPT$" maxhostattempts="$MAXHOSTATTEMPTS$" hostproblemid="$HOSTPROBLEMID$" lasthostproblemid="$LASTHOSTPROBLEMID$"
}

# 'manage-service-tickets' command definition
define command{
command_name manage-service-tickets
command_line php /usr/share/nagios3/plugins/eventhandlers/manage-service-tickets.php servicehost="$HOSTNAME$" servicestate="$SERVICESTATE$" servicestatetype="$SERVICESTATETYPE$" hoststate="$HOSTSTATE$" eventhost="$HOSTNAME$" service="$SERVICEDISPLAYNAME$" serviceattempts="$SERVICEATTEMPT$" maxserviceattempts="$MAXSERVICEATTEMPTS$" lastservicestate="$LASTSERVICESTATE$" servicecheckcommand="$SERVICECHECKCOMMAND$" serviceoutput="$SERVICEOUTPUT$" longserviceoutput="$LONGSERVICEOUTPUT$"
}

Next, modify your host and service templates to include the above event handler commands,

define host{
        name                            generic-host    ; The name of this host template
        notifications_enabled           1       	; Host notifications are enabled
        event_handler_enabled           1       	; Host event handler is enabled
        flap_detection_enabled          1       	; Flap detection is enabled
        failure_prediction_enabled      1       	; Failure prediction is enabled
        process_perf_data               1       	; Process performance data
        retain_status_information       1       	; Retain status information across program restarts
        retain_nonstatus_information    1       	; Retain non-status information across program restarts
		check_command                   check-host-alive
		event_handler		            manage-host-tickets
		max_check_attempts      1
		notification_interval   0
		notification_period     24x7
		notification_options    d,u,r
		contact_groups          admins
        register                        0       	; DONT REGISTER THIS DEFINITION - ITS NOT A REAL HOST, JUST A TEMPLATE!
        }
define service{
        name                            generic-service ; The 'name' of this service template
        active_checks_enabled           1       ; Active service checks are enabled
        passive_checks_enabled          1       ; Passive service checks are enabled/accepted
        parallelize_check               1       ; Active service checks should be parallelized (disabling this can lead to major performance problems)
        obsess_over_service             1       ; We should obsess over this service (if necessary)
        check_freshness                 0       ; Default is to NOT check service 'freshness'
        notifications_enabled           1       ; Service notifications are enabled
        event_handler_enabled           1       ; Service event handler is enabled
        flap_detection_enabled          1       ; Flap detection is enabled
        failure_prediction_enabled      1       ; Failure prediction is enabled
        process_perf_data               1       ; Process performance data
        retain_status_information       1       ; Retain status information across program restarts
        retain_nonstatus_information    1       ; Retain non-status information across program restarts
		notification_interval           0		; Only send notifications on status change by default.
		event_handler		            manage-service-tickets
		is_volatile                     0
		check_period                    24x7
		normal_check_interval           5
		retry_check_interval            1
		max_check_attempts              4
		notification_period             24x7
		notification_options            w,u,c,r
		contact_groups                  admins
        register                        0       ; DONT REGISTER THIS DEFINITION - ITS NOT A REAL SERVICE, JUST A TEMPLATE!
        }

After you are finished be sure to restart the Nagios service.  You will now receive helpdesk tickets in GLPI when alerts are created in Nagios and those tickets will be removed when the service or host has been restored.  GLPI will handle the appropriate  notifications.

Download Here